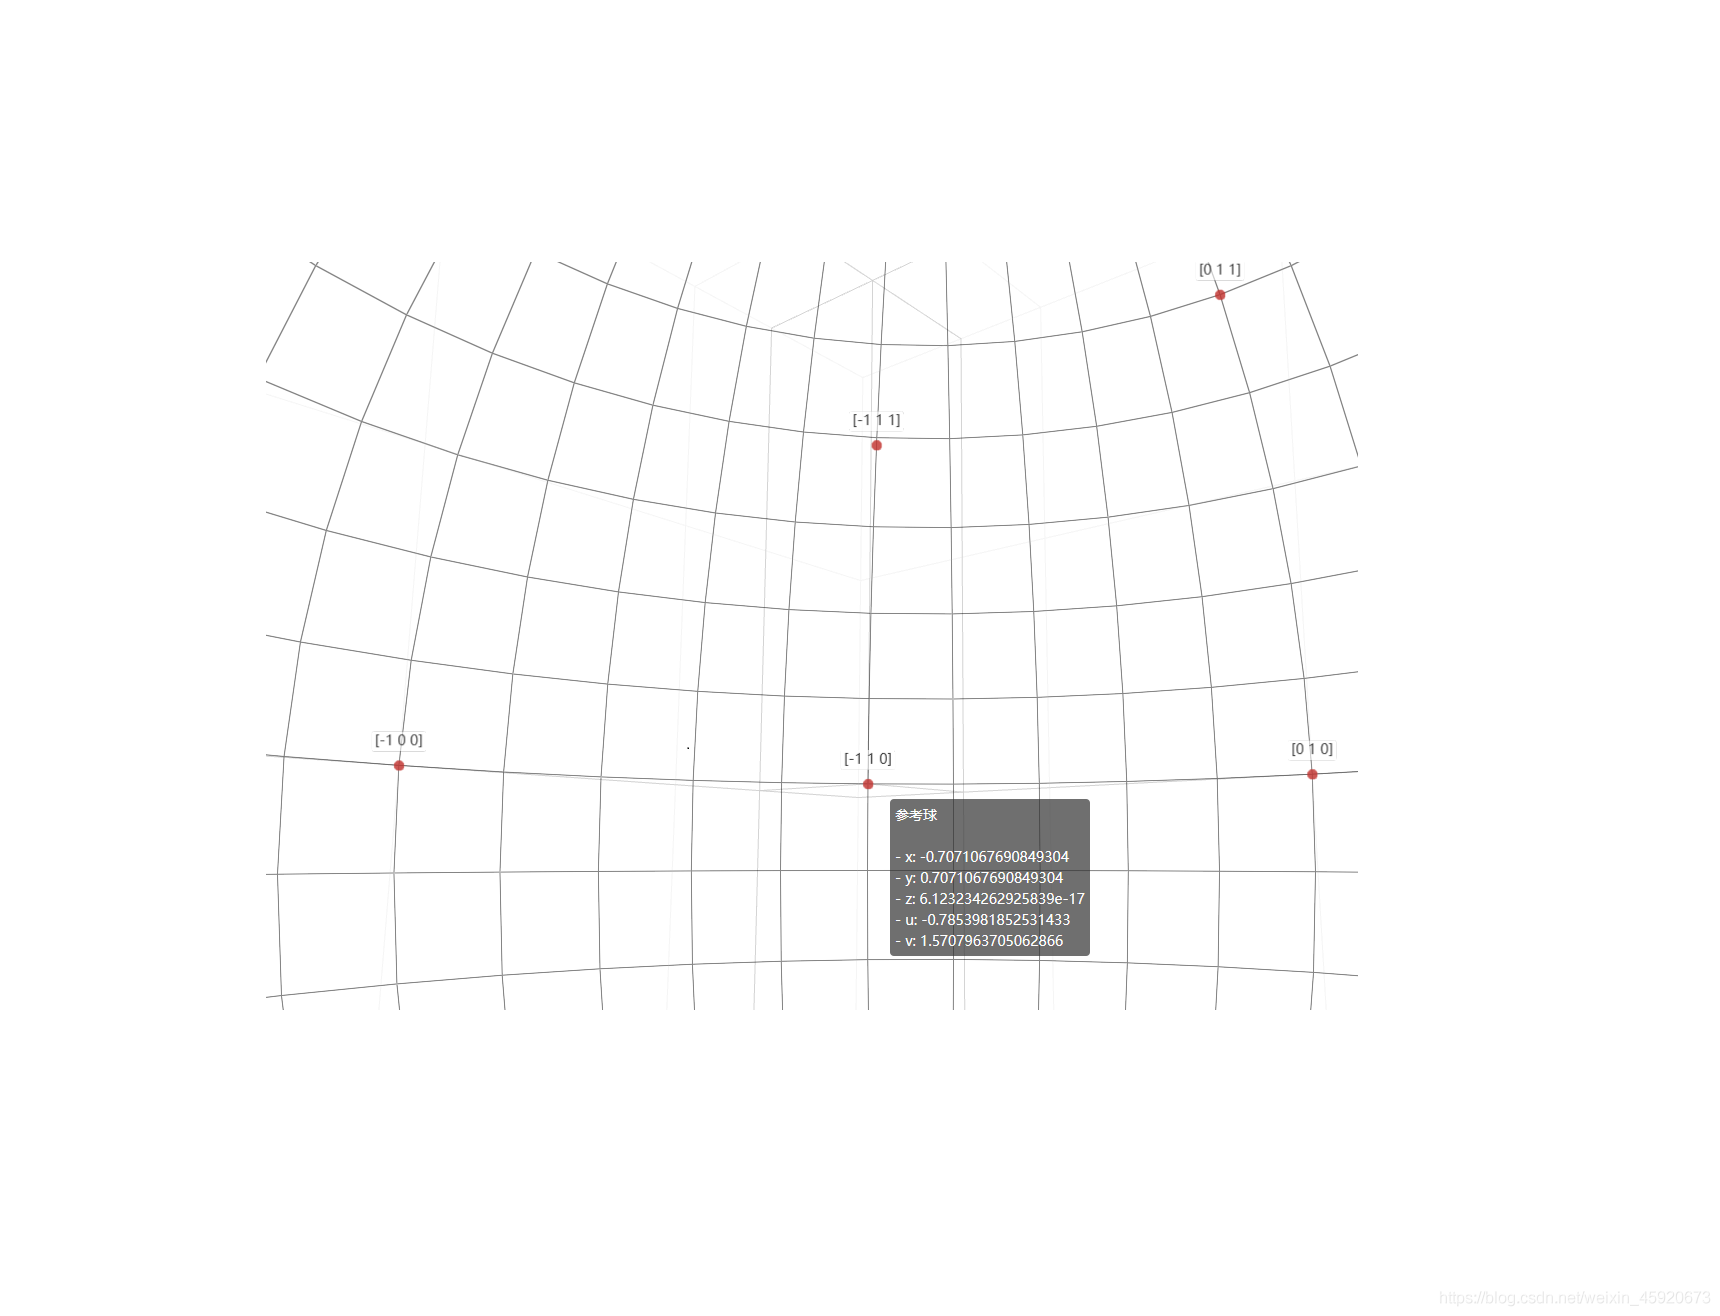
因为固体物理书上的球面投影图太难看,就自学 javascipt 用 echarts 做了个可交互的,效果如下:
上面为立方晶系主要晶面(晶向)的球面投影,具体计算代码如下:
import math
import numpy as np

def c_scale(A):
 A = np.array(A)
 n_dim = A.shape[1]; n_size = A.shape[0]
 scale2 = np.zeros(n_size)
 for j in range(n_dim):
  for i in range(n_size):
   scale2[i] += A[i,j]**2
 scale = scale2 ** 0.5
 return scale

def normalize(A): # 二维数组归一化
 A = np.array(A)
 scale = c_scale(A)
 A = np.divide(A.T,scale).T
 return A

def cal_point_dict(input_str_list):
 points = []; points_dicts = []
 for input_str in input_str_list:
  input_str=input_str.replace('[',''); input_str=input_str.replace(']','')
  try:
   data = input_str.split(' ')
   point = [] # 求解投影点
   for j in range(len(data)):
    point.append(int(data[j]))
   points.append(point)
  except:
   data = input_str.split(',')
   point = [] # 求解投影点
   for j in range(len(data)):
    point.append(int(data[j]))
   points.append(point)
  points_p = normalize(points)
 for i in range(len(points_p)):
  points_dict={}
  points_dict['name']=input_str_list[i]
  points_dict['value']=points_p[i].tolist()
  points_dicts.append(points_dict)
 return points_dicts

# 各晶面指数
input_str_list = ['[0 0 1]','[1 0 0]','[0 1 0]','[0 0 -1]','[-1 0 0]','[0 -1 0]',
     '[1 0 1]','[0 1 1]','[1 1 0]','[-1 0 -1]','[0 -1 -1]','[-1 -1 0]',
     '[1 0 -1]','[0 1 -1]','[1 -1 0]','[-1 0 1]','[0 -1 1]','[-1 1 0]',
     '[1 1 1]','[-1 1 1]','[1 -1 1]','[1 1 -1]',
     '[-1 -1 -1]','[1 -1 -1]','[-1 1 -1]','[-1 -1 1]']
points_dicts = cal_point_dict(input_str_list)
points_dicts # 将该数据复制到 球坐标.html 下
绘图 html 源码:
<!DOCTYPE html> <html style="height: 100%"> <head> <meta charset="utf-8"> </head> <body style="height: 100%; margin: 0"> <div id="container" style="height: 100%"></div> <script type="text/javascript" src="/UploadFiles/2021-04-02/echarts.min.js">然而这样画出的图形还不能实现 3D 空间中的遮挡关系,要进一步实现可能还要借助 echarts 的地理坐标功能。
总结


